
Value Investing Simplified: What Is EV To EBIT Ratio?
Imagine two investors looking at the same market screen.
One investor sees a stock trading at ₹80 and immediately assumes it must be undervalued. Another stock trading at ₹2,500 seems expensive to him without even understanding the business behind it.
The second investor thinks differently.
Instead of focusing only on the share price, he starts asking questions in depth:
- How much debt does the company have?
- How profitable is the business actually?
- How much would it cost to own the entire company?
- Is the business generating healthy operating earnings?
- Are those earnings supported by real cash generation?
That difference in thinking is where value investing truly begins.
In investing, a low stock price does not automatically mean good value, just like a high stock price does not automatically mean a company is overvalued. Sometimes the real picture only becomes clear when investors look at the numbers in depth.
This is exactly why valuation tools like EV/EBIT exist.
EV/EBIT is the ratio to interpret and understand what investors are truly paying for relative to a company’s operating earnings.
In this blog, we’ll break down EV/EBIT in simple language, understand why it matters in value investing, where it works well, where investors should be careful, and how it fits into a broader valuation framework.
Why Valuation Feels Confusing for Most Investors
One of the biggest challenges in investing is figuring out whether a stock is actually fairly valued.
A company trading at ₹100 may still be expensive. Another trading at ₹2,000 may actually offer attractive long-term value. This is where many investors get confused because stock price alone says very little about the actual business.
Most investors begin with popular ratios like the P/E ratio because they are easy to understand. But valuation becomes more complicated when factors like debt, depreciation, taxes, or capital structure start affecting profitability.
For example, two companies may report similar profits, but one may be carrying huge debt while the other operates with a clean and transparent balance sheet. Looking only at net profit or share price can hide these differences completely.
This is why investors often use multiple valuation tools together instead of relying on a single number.
What EV/EBIT Means in Simple Terms
EV/EBIT is a valuation ratio that compares the total value of a business with its operating earnings.
In simple terms:
- EV (Enterprise Value) estimates the total value of the business, including debt obligations.
- EBIT measures the company’s operating profit before interest and taxes, while still accounting for depreciation and amortisation.
Together, the ratio answers an important question:
How much are investors paying for the company relative to the earnings generated by its core business operations?
Suppose a company has an EV/EBIT ratio of 10.
This roughly means investors are willing to pay 10 times the company’s operating earnings to own the business.
For value investors, this becomes a useful way to compare companies and identify businesses that may be undervalued relative to their operating profitability.
Breaking Down Enterprise Value and EBIT
The term sounds complicated mainly because of the abbreviations. Once separated, both concepts become much easier to understand.
What Is Enterprise Value (EV)?
Enterprise Value represents the takeover or the enterprise value of a business.
It includes:
- Market capitalisation
- Total debt
- Preferred shares
- Minority interest
- Minus cash and cash equivalents
The most important idea here is debt.
If someone acquires a company, they do not simply buy the shares. They also inherit the company’s debt obligations. This is why Enterprise Value gives a more complete picture than market capitalisation alone.
Cash is subtracted because available cash can reduce the effective acquisition cost.
In simple language, EV reflects the overall value of the business rather than just its stock market value.
What Is EBIT?
EBIT stands for:
Earnings Before Interest and Taxes
It measures operating profit generated by the business before considering:
- Financing costs
- Interest expenses
- Tax structures
Unlike EBITDA, EBIT does account for depreciation and amortisation. This makes it a stricter and often more realistic measure of profitability for businesses that rely heavily on long-term assets.
Depreciation represents the accounting cost of using assets over time. For asset-heavy businesses, ignoring this expense can sometimes overstate profitability.
This is why EBIT becomes particularly useful when comparing companies across different capital structures while still reflecting the economic impact of asset usage.
Example: How EV/EBIT Is Calculated
Let’s understand this with a simple example.
Suppose Company ABC has:
- Market Capitalisation = ₹8,000 crore
- Total Debt = ₹2,000 crore
- Cash & Cash Equivalents = ₹500 crore
- EBIT = ₹1,200 crore
Step 1: Calculate Enterprise Value (EV)
Enterprise Value = Market Capitalisation + Debt − Cash and cash equivalents
So,
Enterprise Value = ₹8,000 crore + ₹2,000 crore − ₹500 crore = ₹9500 crore
Step 2: Calculate EV/EBIT
EV / EBIT = Enterprise Value / Earnings before interest and taxes
So,
EV/EBIT= ₹9,500 crore / ₹1,200 crore = 7.9x
This means investors are willing to pay around 7.9 times the company’s operating earnings to own the business.
On its own, this number does not automatically tell investors whether the stock is cheap or expensive. Investors usually compare it with:
- Other companies in the same industry
- The company’s historical valuation
- Growth prospects
- Balance sheet strength
- Cash flow quality
- Business stability
This is why EV/EBIT works best as part of a broader valuation framework rather than as a standalone metric.
Why EV/EBIT Is Popular in Value Investing
Value investors often prefer EV/EBIT because it provides a broader view of valuation compared to many traditional ratios.
One major advantage is that it includes debt.
A company may appear attractive on a P/E basis because net profits temporarily look healthy. But once debt is considered, the valuation picture can change significantly. Another important advantage is that EV/EBIT reduces distortions caused by differences in capital structure.
For example, two companies may operate similar businesses, but one company may have much higher debt. Higher interest expenses can reduce net profit and affect the P/E ratio, even if the core operations are similar.
Since EBIT excludes interest costs and EV includes debt, EV/EBIT allows investors to compare operating performance across companies more fairly, regardless of differences in financing structure.
The ratio is also more conservative than EBITDA-based valuation metrics because it retains depreciation and amortisation expenses.
This makes EV/EBIT especially useful for industries with:
- Significant capital expenditure
- Long-lived fixed assets
- High depreciation charges
Examples include:
- Manufacturing
- Telecom
- Infrastructure
- Energy
- Airlines
In these sectors, depreciation is economically meaningful, and ignoring it may overstate actual profitability.
What The Data Shows:
| Portfolio | Annualised Return (%) | Annualised Sharpe Ratio | Annualised Volatility (%) | Maximum Drawdown (%) | Median Rolling Return (%) | |||
| 1-Year | 3-Year | 5-Year | 10-Year | |||||
| EV to EBIT_Top Tercile | 16.59 | 0.42 | 21.41 | -69.53 | 11.12 | 21.25 | 15.16 | 17.02 |
| EV to EBIT_Middle Tercile | 12.46 | 0.3 | 19.21 | -69.45 | 8.14 | 16.19 | 14.01 | 14.69 |
| EV to EBIT_Bottom Tercile | 11.45 | 0.27 | 20.11 | -73.88 | 8.35 | 12.54 | 13.89 | 13.31 |
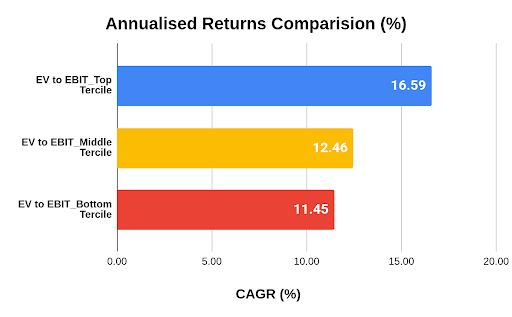
Source: Internal Research, CMIE, NJ AMC's Smartbeta Research Platform. Data is for the period 30th September 2006 to 30th April 2026. EV/EBIT Top, Middle, and Bottom Tercile Portfolios represent Top 33%, Middle 33% and Bottom 34% stocks respectively, based on the EV/EBIT parameter from Nifty 500 Universe. Analysis done on Non-Lending companies only. Past performance may or may not be sustained in the future and is not an indication of future return.
-
The EV to EBIT Top Tercile portfolio delivered the highest annualised return at 16.59%, outperforming both middle and bottom terciles.
-
Higher EV to EBIT portfolios also showed stronger rolling returns across 1-year, 3-year, 5-year, and 10-year periods.
-
Despite generating better returns, the top tercile portfolio experienced volatility and drawdowns comparable to the other groups.
-
The data suggests that companies with relatively stronger EV to EBIT characteristics historically delivered better long-term performance within this analysis.
What a High vs Low EV/EBIT Ratio Tells You
Generally, a lower EV/EBIT ratio may suggest that a company is trading at a relatively attractive valuation compared to its operating earnings. Investors are effectively paying less for each unit of operating profit generated by the business.
However, the interpretation becomes more meaningful when viewed alongside the company’s broader business fundamentals.
For example, a lower EV/EBIT ratio may sometimes reflect:
- Slower future growth expectations
- Market pessimism
- Business uncertainty
- Financial stress
- Cyclical earnings risks
On the other hand, companies with:
- Competitive advantages
- Consistent earnings
- Strong management
- Better growth visibility
- Superior capital allocation
often trade at higher EV/EBIT valuations because investors are willing to pay a premium for business quality and long-term earnings stability.
This is why EV/EBIT works best when evaluated alongside factors like growth potential, balance sheet strength, cash flow quality, and overall business durability.
How to Use EV/EBIT Alongside Other Value Metrics
Experienced investors often combine EV/EBIT with other important financial metrics such as:
- P/E Ratio
- Price-to-Book Value
- Return on Equity (ROE)
- Free Cash Flow
- Debt-to-Equity Ratio
- Return on Capital Employed (ROCE)
For example:
- A company with low EV/EBIT but rapidly rising debt may still carry significant risks.
- A business trading at a slightly higher valuation but generating strong free cash flow may create better long-term shareholder outcomes.
This balance between valuation and business quality is what often separates disciplined value investing from simple bargain hunting.
Conclusion
Going back to our two investors, the real difference was never about the stock price displayed on the screen.
It was about understanding the business behind the number.
The investor who looked beyond surface-level prices and focused on debt, operating earnings, and business value was thinking like a value investor. That is exactly where EV/EBIT becomes useful.
It helps investors move beyond simple stock prices and understand what they are truly paying for relative to the company’s operating strength.
More importantly, it reminds investors that valuation is never just about finding the lowest-priced stock. It is about finding businesses where the value offered makes sense relative to the quality, earnings power, and long-term sustainability of the business.
Like every financial metric, EV/EBIT has limitations. But when used with proper context and alongside other valuation measures, it can become a practical tool for making smarter investing decisions.
Because in the end, successful value investing is rarely about reacting to numbers quickly.
It is about understanding what those numbers are actually trying to say.
FAQs
Q) What does EV/EBIT mean in investing?
EV/EBIT is a valuation ratio that compares a company’s total business value with its operating earnings before interest and taxes, while still accounting for depreciation and amortisation. It helps investors evaluate whether a company may be undervalued or overvalued relative to its operating profitability.
Q) Why is EV/EBIT important in value investing?
EV/EBIT provides a broader valuation picture because it includes debt and focuses on operating performance. It also retains depreciation expenses, making it more conservative than EBITDA-based valuation measures.
Q) Which industries commonly use EV/EBIT analysis?
EV/EBIT is commonly used in industries like manufacturing, telecom, infrastructure, energy, and airlines where capital expenditure and depreciation are significant.
SEBI Registered Name (Number): NJ Mutual Fund (MF/076/21/02) | Details of Other Regulatory Registrations: https://shorturl.at/SEBua
Investors are requested to consult their financial or tax advisor before making any investment decisions.
MUTUAL FUND INVESTMENTS ARE SUBJECT TO MARKET RISKS. READ ALL SCHEME-RELATED DOCUMENTS CAREFULLY.
« Previous Next »