
Low Volatility Factor: The Key to Navigating Market Uncertainty
Investors often grapple with the challenge of maintaining stability amidst fluctuations. While many investment strategies largely focus on maximizing returns, they may fail to provide a shield to the investment portfolio during volatile periods. This is where the low volatility factor steps in. The low volatility factor, an integral part of factor investing, focuses on minimizing risk while achieving better risk-adjusted returns.
About Low Volatility Factor Investing
For a better understanding, think of the low volatility factor investing strategy similar to driving on a well-paved, stable road instead of a windy, steep mountain path full of sharp turns and drops. Even though the mountain path provides the thrill of speed and incredible views, it also comes with a high risk of accidents. On the other hand, the well-paved road would provide a smoother and safer journey just like low volatility factor investing.
Similarly, the low volatility factor targets stocks that have historically showcased minimum price fluctuations, expecting to provide a smoother investment journey. This strategy leverages, “The Low Volatility Anomaly” which challenges traditional financial theories and asset pricing models such as the Capital Asset Pricing Model (CAPM) that emphasizes a positive correlation between expected returns and volatility. Highlighted by Frazzini and Pederson (2014) in their seminal paper titled “Betting Against Beta”, indicates that low-volatile stocks provide better returns than high-volatile stocks contradicting traditional models viz—the CAPM.
How to Measure the Low Volatility Factor
Deriving a reliable low volatility factor definition has been a challenging topic. However, the core concept lies in analyzing the stock’s price movement across periods to determine its relative stability. A few common methods used to measure low volatility factor include:
-
Standard Deviation:
Standard deviation measures the amount of dispersion in a stock’s price as to the mean, or average, returns. A lower standard deviation would indicate that a stock's price is closer to its average, suggesting lower volatility. Stocks having low standard deviation tend to have less fluctuations in their prices and exhibit consistent returns and are thus considered less volatile.
-
Beta:
Beta quantifies a stock's sensitivity to market movements i.e. relative volatility of a stock with respect to the movement in the market, generally proxied by market indices viz. NIFTY 50, BSE SENSEX, NIFTY 500 etc. A beta of 1 indicates that the stock is as volatile as the market and tends to fall/increase in the same proportion as the index. Low beta stocks, generally having betas well below 1, tend to increase less when the market goes up but subsequently shield investors from steep falls when the market corrects.
-
Semi-deviation:
Sem-deviation, also known as downside deviation, focuses on the negative price movements of the stock. It helps assess the volatility of stocks with respect to the negative returns or below mean returns, thus giving a more accurate insight into the downside risk vis-a-vis standard deviation that also penalizes stocks for upward deviations.
Benefits of Low Volatility Factor Investing
A low volatility factor can be a well-guarded strategy to be incorporated into any investor’s investment portfolio. By including low volatile stocks this strategy ensures to reduce overall portfolio risk. This can be highly effective during market uncertainty, proving to be your life jacket!
Performance of Low Volatility Factor
The Low Volatility Factor Effect has been widely observed across global markets, including India. Research has shown that low-volatility portfolios outperform their high-volatility counterparts over the long term, particularly during economic stress or market corrections. The same can be interpreted based on the graph below. The graph shows a comparison of $1,000 invested in the S&P 500 Low Volatility TRI Index versus the S&P 500 TRI Index.
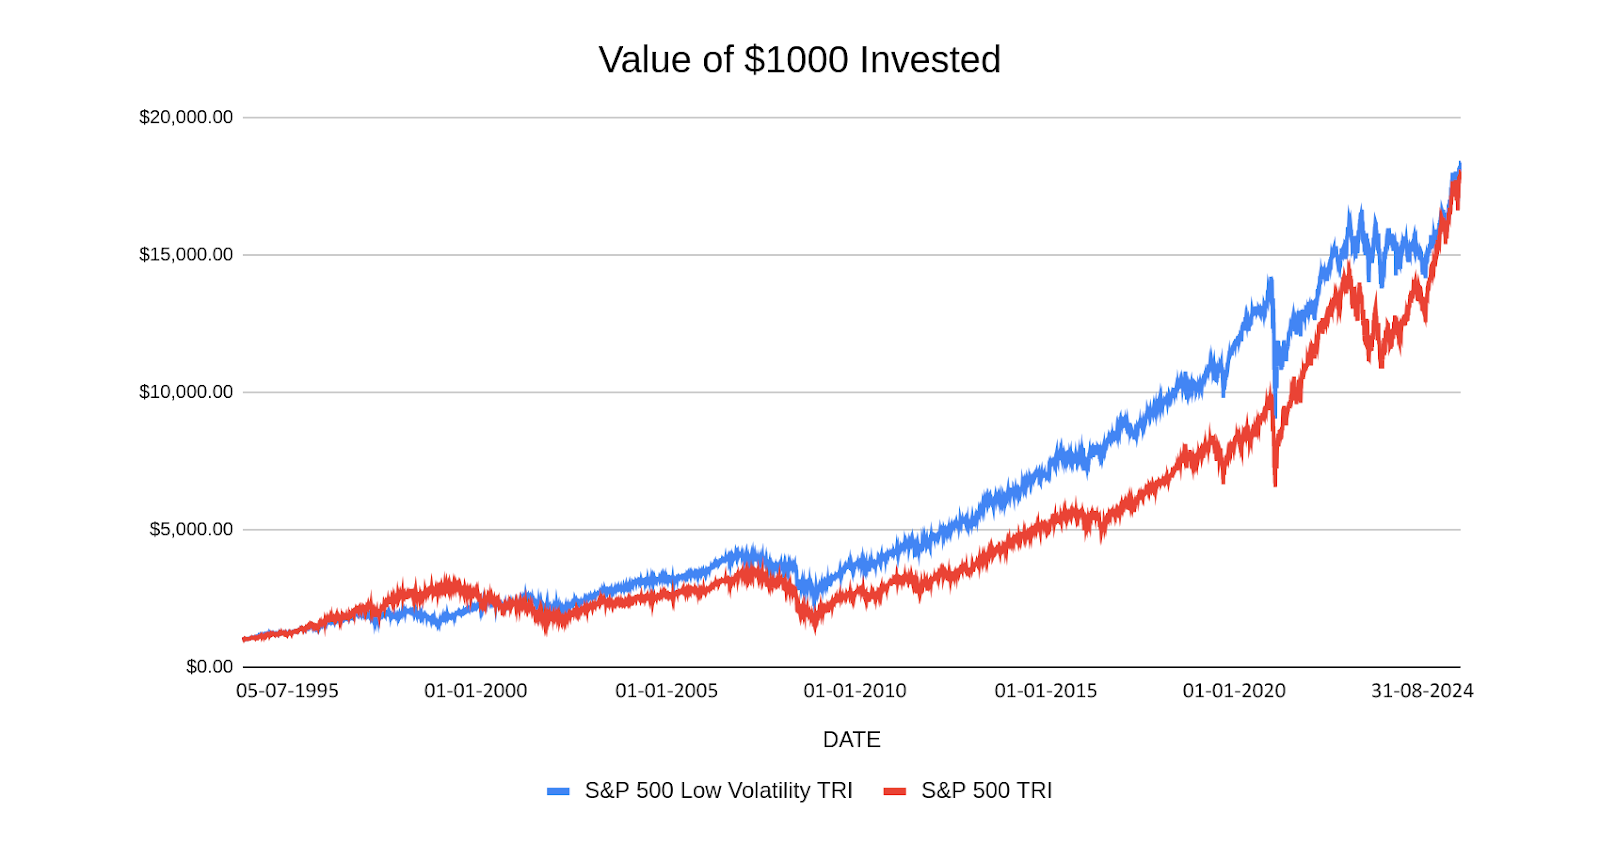
Past performance may or may not be sustained in future and is not an indication of future return. The above is only for illustration purposes and should not be construed as indicative return of offering of NJ Asset Management Private Limited.
Source: Internal research, Bloomberg, NJ’s Smart Beta Platform (in-house proprietary model of NJAMC). This chart depicts the growth in the NAVs of S&P 500 Low Volatility factor based indices vis-a-vis that of the S&P 500 Index over the period 5th July 1995 to 31st August 2024. All the NAVs are in USD and have not been converted to INR. All the indices have been scaled to $1,000 as of 5th July 1995.
The following table compares the performance of the S&P 500 Low Volatility Index against the S&P 500 index. A lower standard deviation indicates that the low volatility strategy experiences less fluctuations in its risk-adjusted returns, offering a more stable investment approach.
The Sharpe Ratio measures the risk-adjusted return. A higher Sharpe ratio indicates that the Low Volatility index delivers better returns for the risk taken.
Lastly, the S&P 500 Low Volatility Index has a lesser maximum drawdown, meaning it experiences smaller peak-to-trough declines during market downturns. This indicates that the low volatility strategy helps mitigate losses during extreme market conditions.
| |
Returns (CAGR) (%) | Annualized Standard Deviation (%) | Annualized Sharpe Ratio | Maximum Drawdown (%) |
| S&P 500 Low Volatility TRI | 10.49 | 14.71 | 0.16 | -40.40 |
| S&P 500 TRI | 10.42 | 19.01 | 0.10 | -55.25 |
Source: CMIE, NJ’s Smart Beta Platform (in-house proprietary model of NJAMC). Data for the period 5th July 1995 to 31st August 2024. Past performance may or may not be sustained in future and is not an indication of future return.
NJ Low Volatility+ Model
The NJ Low Volatility model represents a novel strategy in the realm of factor investing. The model incorporates low volatile stocks screened based on stock price movement over the previous 12 to 36 months. The portfolio methodology used to construct this model includes selecting 100 stocks with the lowest volatility from a pool of 500 stocks.
A comparison between Nifty 500 TRI and NJ Low Volatility+ model based on an investment of Rs.1000 is drawn in the following graph. It can be seen that investment in the NJ Low Volatility+ model yields better returns than the Nifty 500 TRI index.
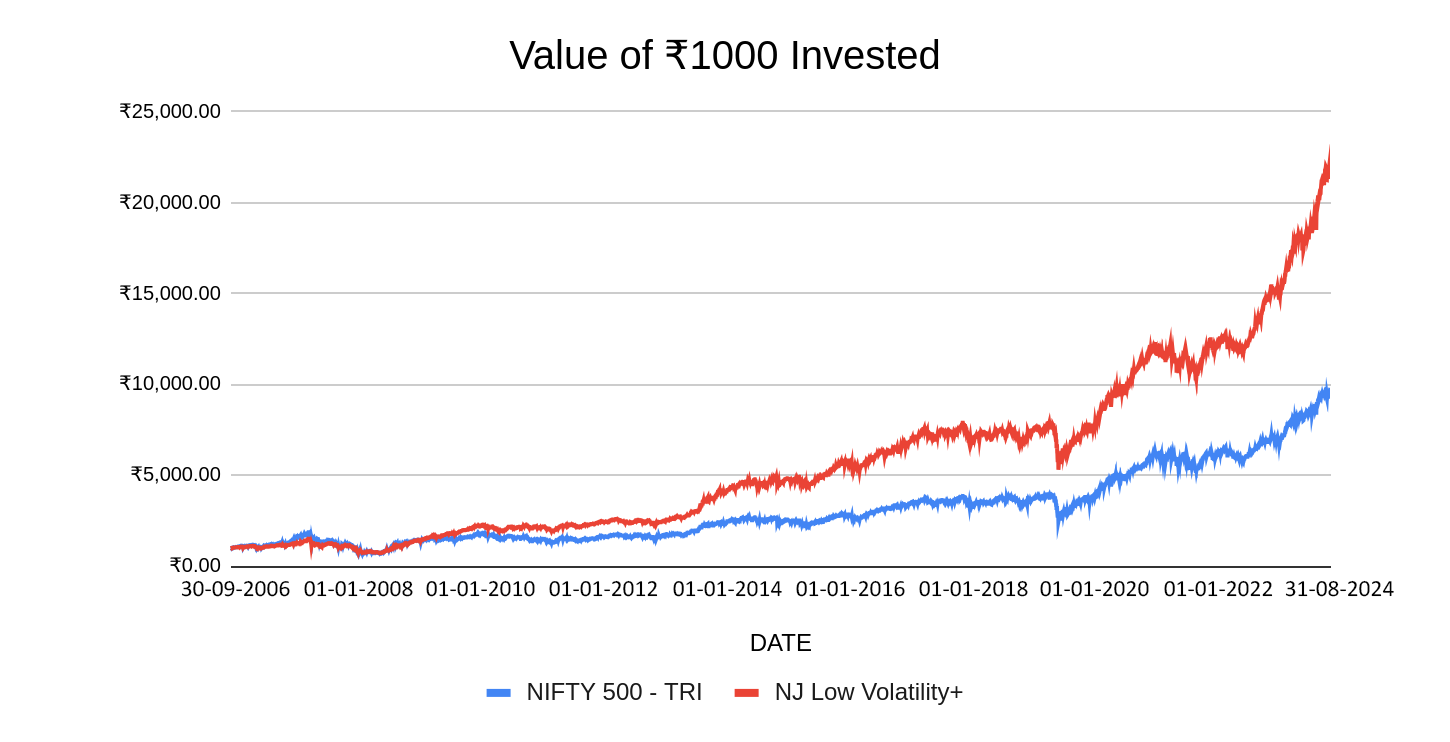
Past performance may or may not be sustained in future and is not an indication of future return. The above is only for illustration purposes and should not be construed as indicative return of offering of NJ Asset Management Private Limited.
Source: Internal research, Bloomberg, CMIE, National Stock Exchange, NJ’s Smart Beta Platform (in-house proprietary model of NJAMC). Calculations are for the period 30th September 2006 to 31st August 2024. NJ Low Volatility+ is an in-house proprietary methodologies developed by NJ Asset Management Private Limited. The methodologies will keep evolving with new insight based on the ongoing research and will be updated accordingly from time to time. All the indices have been scaled to ₹1,000 as of 30th September 2006.
A similar comparison of the NJ Low Volatility+ Model and the Nifty 500 Index has been done in the below table. The NJ Low Volatility+ model has a notably lower standard deviation, which indicates lower volatility and more stable returns.
The Sharpe Ratio for the NJ Low Volatility+ Model is higher, indicating better risk-adjusted returns, and similarly, the maximum drawdown is low in comparison to the Nifty 500 Index. This suggests that a low volatility factor strategy helps limit losses more effectively during severe market corrections.
| |
Returns (CAGR) (%) | Annualized Standard Deviation (%) | Annualized Sharpe Ratio | Maximum Drawdown (%) |
| NJ Low Volatility+ | 18.88 | 14.55 | 0.65 | -52.63 |
| NIFTY 500 - TRI | 13.55 | 20.30 | 0.35 | -63.71 |
Source: CMIE, NJ’s Smart Beta Platform (in-house proprietary model of NJAMC). Data for the period 5th July 1995 to 31st August 2024. Past performance may or may not be sustained in future and is not an indication of future return.
Conclusion
For risk-averse investors, low volatility factor Investing provides a useful tool to navigate the world of volatile markets and uncertain economic conditions. Achieving stable returns can become easier with a concentrated focus on stocks, whose prices showcase lower fluctuations over the period. Implementing a low volatility factor strategy in your investment portfolio can be the key to your financial success.
FAQs
1) What does the low volatility factor mean?
The low volatility factor aims to reduce risk by selecting stocks with lower price fluctuations across time periods. This helps mitigate any obstacles the investment portfolio may face during uncertain market conditions.
2) Which is better, high or low volatility?
Whether high or low volatility is better depends on the investors' risk tolerance and financial goals. Risk-averse investors generally prefer low volatility to seek steady returns. On the other hand, investors looking for faster growth and willing to take excessive risks may opt for a high-volatility strategy.
3) How can investors identify stocks with low volatility?
Investors can use certain key metrics that measure the volatility of a stock such as standard deviation, beta, and semi-deviation to identify stocks with low volatility.
Investors are requested to take advice from their financial/ tax advisor before making an investment decision.
MUTUAL FUND INVESTMENTS ARE SUBJECT TO MARKET RISKS, READ ALL SCHEME RELATED DOCUMENTS CAREFULLY.
« Previous Next »