
Perceived Quality in Investing: Understanding the Perception-Reality Gap
A company is growing rapidly. Profits are rising. Stock price doubling. Is it a quality company? Maybe yes. But maybe not.
Companies that look good on the surface due to high earnings growth, brand recall, or popularity may lack the fundamentals that define true quality. This gap between what is often assumed and what the fundamentals actually show is called perceived quality, and relying solely on it can be risky.
Now the question is: how do we differentiate between perception and reality?
What is Perceived Quality?
Perceived quality refers to the impression that a company is fundamentally strong, based on surface-level traits rather than its actual financials and operational health. It’s the kind of quality that’s assumed, not proven.
This perception often builds around factors like strong brand visibility, rapid earnings or revenue growth, frequent media attention, and high stock valuations. While these factors can signal success, they may mask weak balance sheets, inconsistent cash flows, or poor governance.
When market conditions turn, such gaps are exposed, and the cost of mistaking perception for quality can be significant.
Evolution of Quality Over Time
Decades ago, profitability was seen as the hallmark of quality. But as markets matured, so did the definition. Today, quality is seen as a multi-dimensional concept. It goes beyond just how much a company earns, and looks deeper into how it earns, how sustainably it grows, and how transparently it operates.
This evolution can be broadly understood in three phases:
- Profitability-centric quality: Early definitions focused mainly on metrics like Return on Equity (RoE) and profit margins. High profits were equated with quality.
- Financial strength and stability: As more data became available and investors experienced market cycles, factors like low leverage, consistent earnings, and healthy cash flows gained importance.
- Governance, capital allocation, and sustainability: In today’s investing landscape, quality also includes softer yet critical aspects like management integrity, capital discipline, and governance practices.
The chart below shows how the market’s understanding of quality has matured over the years.
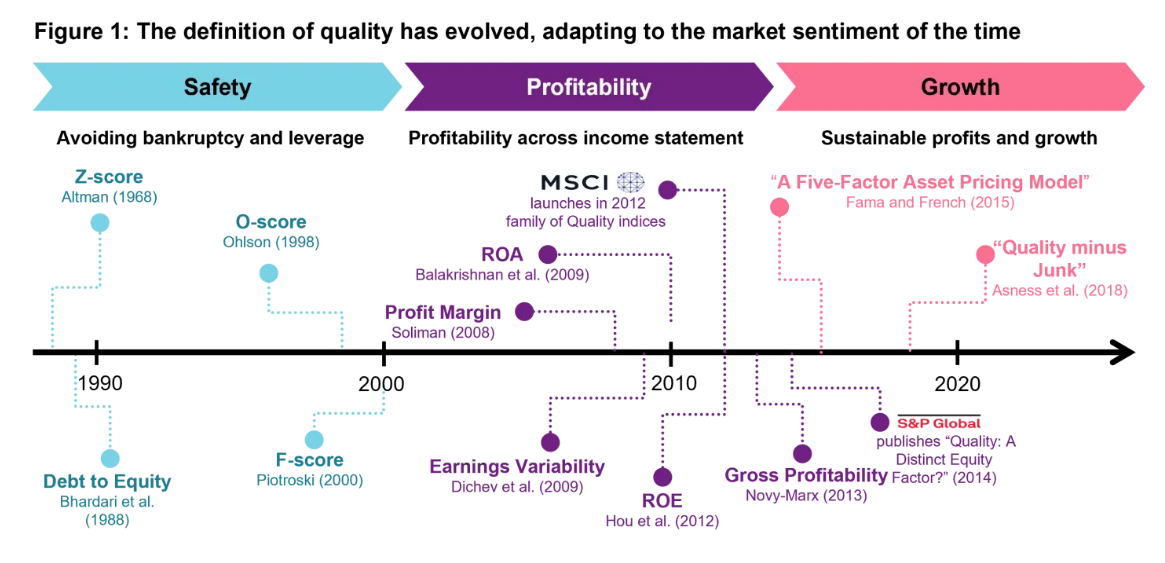
Source: Vontobel. For illustration purposes only.
Defining True Quality
Over time, the definition of quality has become more layered. It’s no longer just about profitability or growth. What sets a truly high-quality company apart is a combination of:
- High and consistent profitability
- Low leverage and strong balance sheets
- Stable earnings and healthy dividends
- Clean accounting and sound governance
When quality is defined using a single parameter, like profitability or low leverage, it may miss out on other crucial aspects of business strength. But when all key quality parameters are combined in a cohesive model, like the NJ Quality+ Model, the results speak for themselves.
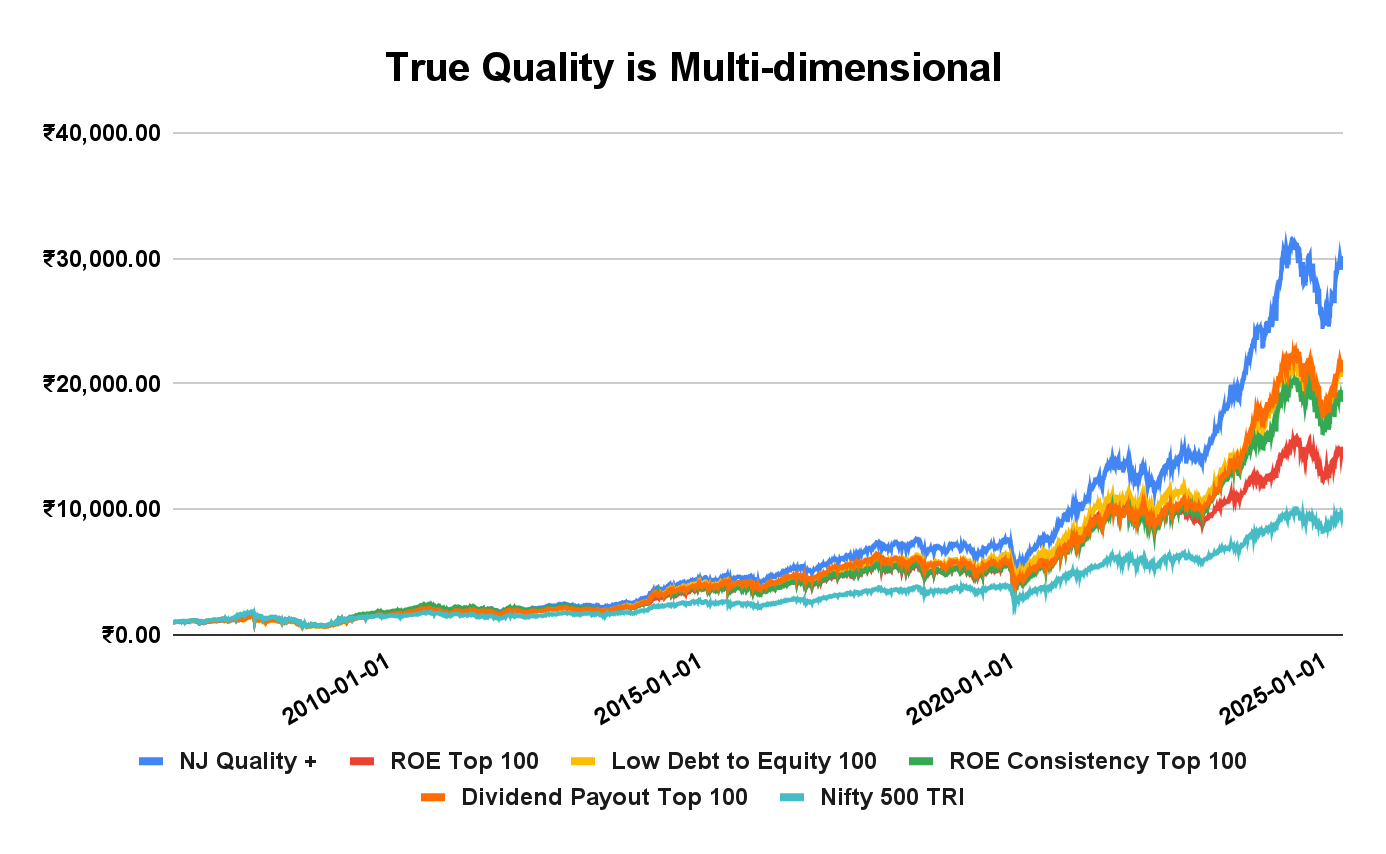
Source: CMIE, Internal research. The period for calculation is 30th September 2006 to 30th June 2025. Past performance may or may not be sustained in future and is not an indication of future return. NJ Quality+ Model is a proprietary methodology developed by NJ Asset Management Private Limited. The methodology will keep evolving with new insight based on the ongoing research and will be updated accordingly from time to time.
| From Sep 2006 to Jun 2025 | CAGR (%) | Annualised Volatility (%) | Maximum Drawdown (%) | 5-Year Rolling Mean Return | 10-Year Rolling Mean Return |
| NJ Quality + | 19.92 | 16.87 | -59.05 | 20.04 | 19.78 |
| ROE Top 100 | 15.51 | 17.44 | -63.94 | 15.92 | 15.96 |
| Low Debt to Equity 100 | 17.75 | 16.98 | -60.49 | 18.16 | 17.99 |
| ROE Consistency Top 100 | 17.14 | 17.74 | -57.90 | 16.23 | 15.95 |
| Dividend Payout Top 100 | 17.87 | 17.23 | -60.31 | 17.71 | 17.61 |
| Nifty 500 TRI | 12.92 | 20.10 | -63.71 | 12.51 | 12.59 |
Source: CMIE, Internal research. The period for calculation is 30th September 2006 to 30th June 2025. Past performance may or may not be sustained in future and is not an indication of future return. NJ Quality+ Model is a proprietary methodology developed by NJ Asset Management Private Limited. The methodology will keep evolving with new insight based on the ongoing research and will be updated accordingly from time to time.
The data shows that the NJ Quality+ model not only delivers superior long-term returns but also demonstrates lower volatility and more consistent 5-year and 10-year rolling returns than individual quality parameters, which are hallmarks of genuine quality investing.
True Quality Performs and Protects
The idea that quality protects during downturns and compounds steadily over time is not just theory; it’s backed by data and research.
Some studies on the Indian equity market have revealed that the differentiation between strong and weak fundamentals plays a critical role in generating returns. In particular, a study* examining the “Quality Minus Junk” (QMJ) strategy found that a substantial portion of the strategy’s returns stemmed from shorting poor-quality stocks, highlighting how the ability to identify and avoid low-quality stocks can significantly enhance portfolio performance.
These findings are well-reflected in the chart below. The NJ Quality+ portfolio has outperformed both the low-quality model and the broader Nifty 500 TRI across all time frames, not just in returns, but also in terms of volatility.
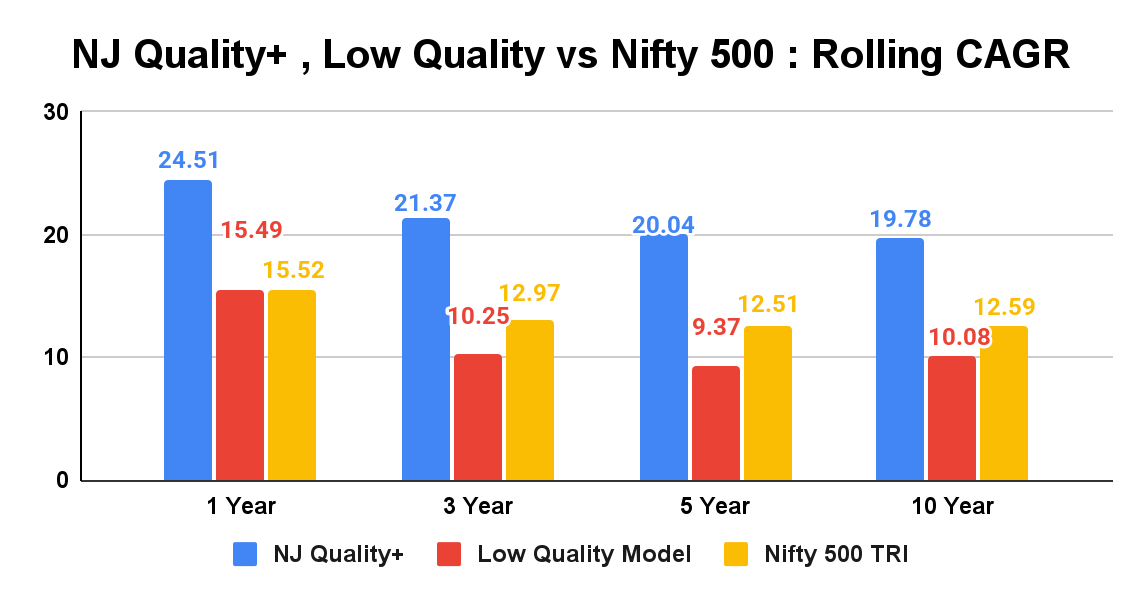
Source: Internal research, CMIE, NSE. Average of daily rolling returns calculated for the different holding periods. The period for calculation is 30th September 2006 to 30th June 2025. Past performance may or may not be sustained in future and is not an indication of future return. NJ Quality+ Model and Low Quality Model are proprietary methodologies developed by NJ Asset Management Private Limited. The methodology will keep evolving with new insight based on the ongoing research and will be updated accordingly from time to time.
| From Sep 2006 to Jun 2025 | Cumulative Growth of ₹1000 | Annualised Volatility (%) | 5 Yr Period Loss Probability (%) |
| NJ Quality+ | ₹30,186 | 16.87 | 0.00 |
| Low Quality Model | ₹5,486 | 22.91 | 17.27 |
| Nifty 500 TRI | ₹9,778 | 20.10 | 1.18 |
Source: Internal research, CMIE, NSE. The period for calculation is 30th September 2006 to 30th June 2025. Past performance may or may not be sustained in future and is not an indication of future return. NJ Quality+ Model and Low Quality Model are proprietary methodologies developed by NJ Asset Management Private Limited. The methodology will keep evolving with new insight based on the ongoing research and will be updated accordingly from time to time.
Cost of Mistaking Perceived Quality
Mistaking perception for quality can turn out to be costly and lead to various risks:
- Capital erosion when the story fades
- Poor risk-adjusted returns
- Volatility due to unstable fundamentals
- Poor downside protection
What seemed like a “safe bet” may lead to steep drawdowns, especially during market corrections.
How to Avoid the Trap
Recognising true quality requires looking beyond the surface. Here are a few things to keep in mind throughout the market phases:
- Don’t chase only recent EPS growth
- Look at balance sheet quality, RoCE, and cash flows
- Beware of promoter pledging, auditor resignations, and governance red flags
- Favour companies with transparency, consistency, and prudent capital allocation
- Use quality-focused mutual funds or rule-based strategies to filter out noise
A rule-based approach helps avoid biases and perceptions about companies by evaluating them objectively, based on fundamentals. It cuts through market noise, helping reduce the risk of costly mistakes.
Why does this matter today? In bull markets, perception dominates. But over time, only true quality sustains. The Indian market has seen many “growth darlings” fall, highlighting the need to evolve from growth-chasing to quality-seeking.
Conclusion
The real risk is not market volatility, but owning the wrong business. Perceived quality may perform in the short term. But when markets test resilience, only true quality stands firm. Identifying quality businesses early and staying invested through a structured approach can help avoid costly mistakes and improve long-term outcomes.
At NJ Mutual Fund, a 100% rule-based and quality-focused approach forms the foundation of our investment process. This strong and consistent focus on quality helps us build portfolios that are resilient across market cycles and aligned with long-term financial goals.
FAQs
Q) What is the quality factor in investing?
The quality factor refers to investing in companies with strong and sound financial health, like high profitability, low debt, stable earnings, and good governance.
Q) What is the difference between quality and perceived quality in investing?
True quality is backed by fundamentals. Perceived quality, on the other hand, is based on how a company appears, which may not reflect its actual strength.
Q) Why is perceived quality risky for long-term investors?
Perceived quality can be misleading. Companies that seem attractive on the surface may struggle when the market turns. Without real financial strength or governance, they may not sustain performance in the long run.
*Kaur, S., Seth, S., & Singh, J. (2024). Value and quality investing strategy in Indian stock market. Managerial Finance, 50(9), 1662–1680. https://doi.org/10.1108/mf-02-2023-0112
Investors are requested to take advice from their financial/ tax advisor before making an investment decision.
MUTUAL FUND INVESTMENTS ARE SUBJECT TO MARKET RISKS, READ ALL SCHEME RELATED DOCUMENTS CAREFULLY.
« Previous Next »