
NJ AMC Forensic & Governance Model: From Red Flags to Resilience
Forensic and governance analysis plays a pivotal role in ensuring the integrity and quality of investment decisions at NJ AMC. This process helps identify potential red-flagged companies, safeguarding investor interests and enhancing portfolio resilience.
At NJ AMC, we have taken this a step further by transforming qualitative forensic and governance insights into precise, data-driven inputs for our factor investing strategies. By embedding the following parameters into our model, we effectively filter out companies with potential governance or financial red flags, ensuring that our investments are rooted in trust and transparency.
NJ AMC’s Forensic & Governance Model: Quantitative Approach
NJ AMC’s Forensic & Governance Model is designed to detect red flags through quantitative measures. The model identifies companies prone to:
- Earnings Manipulation: Detecting aggressive revenue recognition practices.
- Hidden Liabilities: Uncovering off-balance-sheet debts.
- Governance Risks: Assessing factors like promoter integrity and independence of auditors.
The following are a few of the many parameters used to evaluate the stocks:
- Promoter Pledge: This measures the percentage of promoters' shares pledged as collateral. A high promoter pledge ratio can indicate financial stress or over-leveraging by the promoters, which could pose risks to the company's financial stability and governance practices.
- Operating Cash Flow to EBITDA: This ratio compares the actual cash generated from operations to earnings before interest, taxes, depreciation, and amortization. A significant discrepancy may suggest earnings manipulation such as aggressive revenue recognition by inflating receivables, channel stuffing and over-invoicing, and inventory manipulation. As a thumb rule, a ratio between 80% to 200% of EBITDA is generally considered as healthy.
- Contingent Liabilities to Net Worth: This parameter assesses potential obligations, often camouflaged in the notes outside a company’s balance sheet, that could impact a company's financial stability and solvency. A high ratio indicates that contingent liabilities if recognised as actual and measurable liabilities, pose significant risks to a company’s future net worth.
- Auditor Remuneration Growth: A significant increase in auditor fees may indicate potential conflicts of interest, a lack of independence, or the need for more extensive auditing due to concerns about the company’s financial health. If auditor fees rise disproportionately compared to revenue or profit growth, it could suggest undisclosed financial risks, increased scrutiny, or potential financial misreporting.
Performance of Forensic & Governance Parameters
The following graphs and tables showcase the performance of respective forensic and governance parameters in comparison to the Nifty 500 Index. The graph showcases the growth of ₹1000 Invested in respective portfolios while the tables compare the performance of the respective portfolios on different metrics.
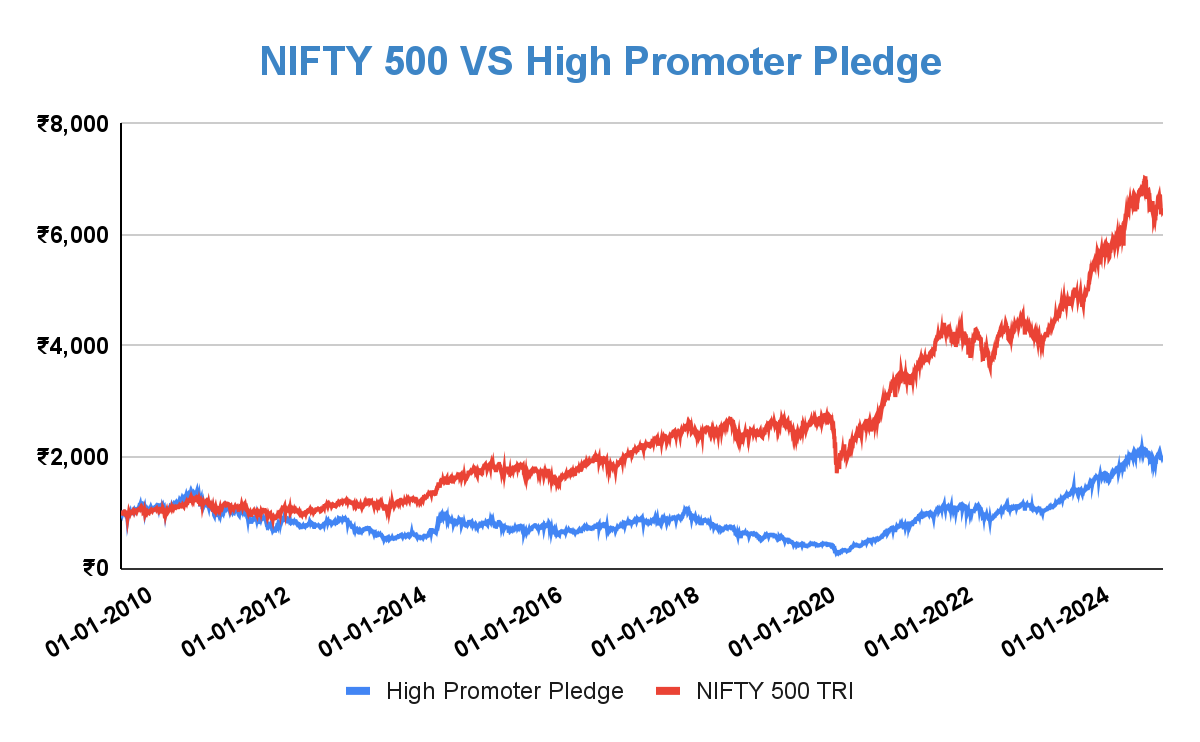
Source: CMIE, NJ’s Smart Beta Platform. Data from September 30, 2009, to December 31, 2024. The High Promoter Pledge portfolio consists of companies that rank in the bottom Decile (Bottom 10%) based on the promoter pledge parameter. Past performance may or may not be sustained in the future and is not an indication of future returns.

Source: CMIE, NJ’s Smart Beta Platform. Data from September 30, 2009, to December 31, 2024. The High Promoter Pledge portfolio consists of companies that rank in the bottom Decile (Bottom 10%) based on the promoter pledge parameter. Probability of Loss (%) is calculated by dividing the number of negative observations by total number of observations. Past performance may or may not be sustained in the future and is not an indication of future returns.
The graph and table highlight the stark underperformance of the High Promoter Pledge portfolio compared to the Nifty 500 TRI. This suggests that companies with a high promoter pledge tend to underperform, possibly due to concerns about financial stability or overleveraging.
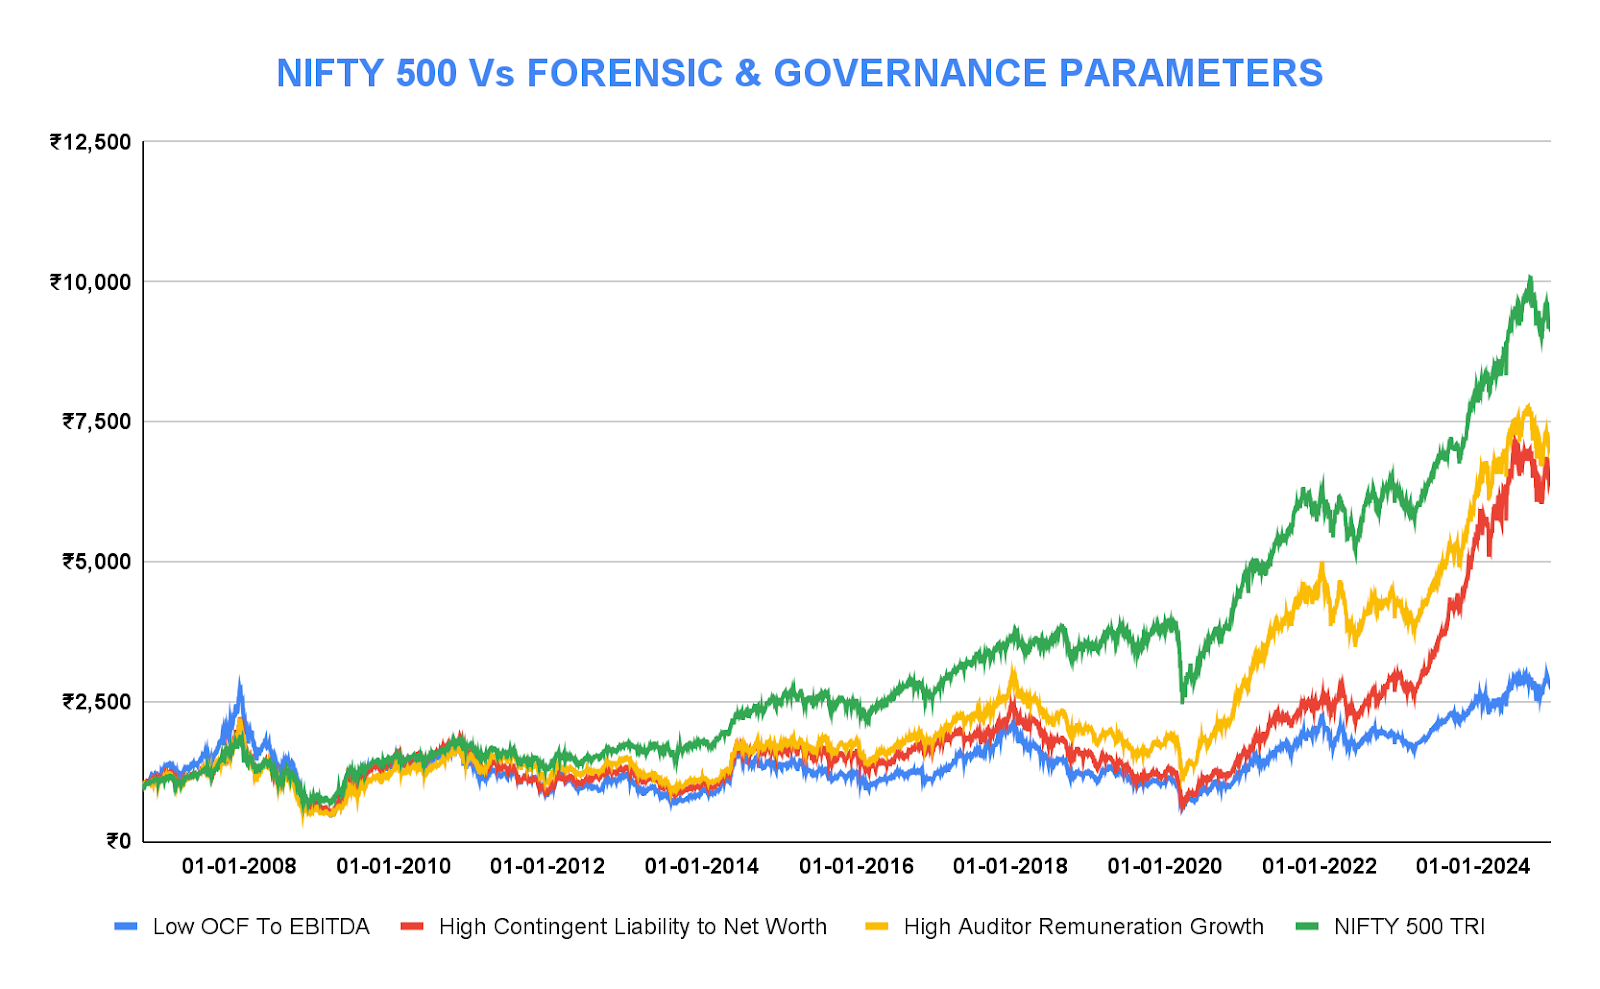
Source: CMIE, NJ’s Smart Beta Platform. Data from September 30, 2006, to December 31, 2024. The Low OCF to EBITDA Portfolio consists of companies falling in the bottom decile based on their OCF to EBITDA values. Only Non Financial companies are considered. Companies with negative EBITDA are not considered. The High Contingent Liability to Net Worth Portfolio consists of companies in the top decile with the highest Contingent Liability to Net Worth parameter values in the Nifty 500 universe. Companies with negative Net Worth and Lending companies are not considered. The High Auditor Remuneration Growth Portfolio consists of the companies from the Nifty 500 universe with the highest growth in auditors’ remuneration parameter values. Past performance may or may not be sustained in the future and is not an indication of future returns.
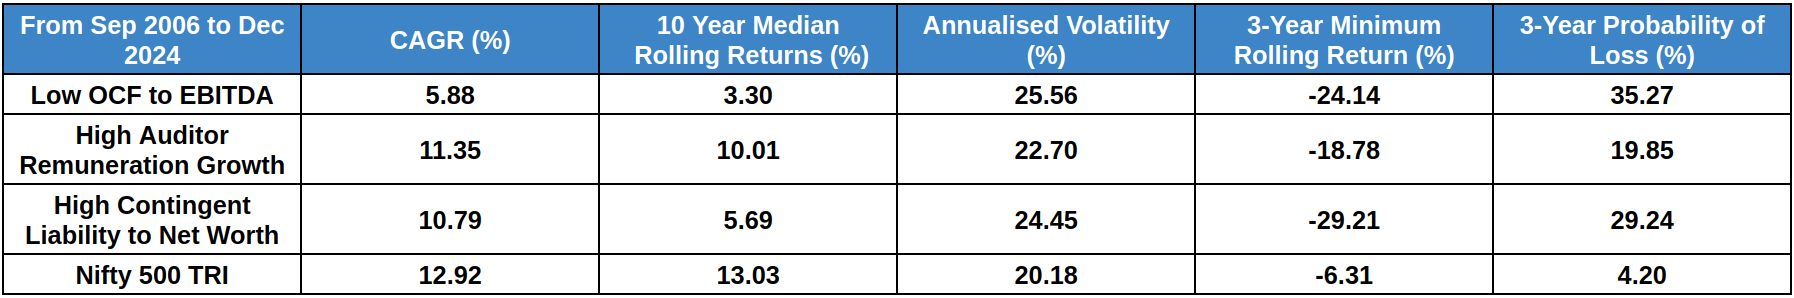
Source: CMIE, NJ’s Smart Beta Platform. Data from September 30, 2006, to December 31, 2024. The Low OCF to EBITDA Portfolio consists of companies falling in the bottom decile based on their OCF to EBITDA values. Only Non Financial companies are considered. Companies with negative EBITDA are not considered. The High Contingent Liability to Net Worth Portfolio consists of companies in the top decile with the highest Contingent Liability to Net Worth parameter values in the Nifty 500 universe. Companies with negative Net Worth and Lending companies are not considered. The High Auditor Remuneration Growth Portfolio consists of the companies from the Nifty 500 universe with the highest growth in auditors’ remuneration parameter values. Probability of Loss (%) is calculated by dividing the number of negative observations by total number of observations. Past performance may or may not be sustained in the future and is not an indication of future returns.
Similarly, the above graph and table showcase that companies with weak forensic and governance parameters, such as low OCF to EBITDA, high auditor remuneration growth, and high contingent liability to net worth, consistently underperform compared to the Nifty 500 TRI. This underscores the importance of strong forensics and governance stance in delivering stable long-term returns.
Forensic & Governance Insights in Action
At NJ AMC, our Forensic & Governance Model is built to systematically detect forensic and governance laggards through a quantitative scoring framework. By evaluating key forensic parameters, the model identifies companies with potential financial weaknesses or governance risks.
Based on the Forensic and Governance model, a specific score is assigned to each company in the Nifty 500 index. The companies are then grouped into 10 deciles, with Decile 1 comprising the highest-scoring companies and Decile 10 the lowest. Our portfolio strategies tend to eliminate companies falling the last two deciles.
The table below highlights key companies that exhibited persistent governance issues and financial weaknesses, placing them in the bottom two deciles for years before their respective scams were exposed.
| Company Name | Year Scam Unfolded | Years in Bottom 2 Deciles | Potential Saving | Key Red Flags as per Model |
| IL & FS Transportation Networks Ltd. | 2018 | 2014 - 2018 | 95.40% | Consistently high Capital Work-In-Progress (CWIP), High and sustained promoter pledge |
| Manpasand Beverages Ltd. | 2019 | 2016 - 2018 | 96.29%* | Inconsistent Tax Recognition, Sharp increase in auditor fees over consecutive years |
| Jet Airways (India) Ltd. | 2019 | 2016 - 2018 | 91.06% | High Contingent Liabilities relative to Net Worth, Significant goodwill impairment |
| Cox & Kings Ltd. | 2020 | 2011 - 2019 | 46.43% | Significant goodwill impairment, High and sustained promoter pledge |
| Religare Enterprises Ltd. | 2018 | 2009 - 2017 | 60.97% | Inconsistent Tax Recognition, High and sustained promoter pledge |
Source: CMIE, NJ’s Smart Beta Platform. The portfolios are constructed by ranking all Nifty 500 companies based on their forensic scorecard scores and dividing them into ten deciles. Each decile forms a separate portfolio, with Decile 1 containing the highest-scoring companies and Decile 10 the lowest. Potential saving is calculated as maximum drawdown within 1 year from the date on which the scam unfolded. Prices are adjusted for corporate actions. Past performance may or may not be sustained in the future and is not an indication of future returns. The above should not be construed as a recommendation to buy/sell any stocks specified above. The above content is based on the internal research process. The AMC may or may not hold the above stock in its portfolio. Investors should consult their own advisors, and tax consultants before making any decision. * For Manpasand Beverages Ltd. max drawdown is considered from the date of unfolding of the scam till the date the stock was listed.
Scams are rarely sudden events. They are typically the result of years of financial misrepresentation and governance lapses. This reinforces the importance of forensic and governance analysis as a critical tool for early detection. By identifying potential red flags at an early stage, such analysis acts as a safeguard against significant financial and reputational damage.
Conclusion
NJ AMC's Forensic and Governance Model exemplifies a disciplined approach to factor-based investing by embedding governance and forensic checks into the investment process. By proactively identifying companies with potential governance or financial red flags, the model ensures that investments are rooted in trust, transparency, and resilience.
FAQs
Q) What is forensic analysis?
Forensic analysis in the context of investing involves a systematic evaluation of a company’s financial and governance practices to detect potential red flags, such as earnings manipulation, hidden liabilities, or governance risks.
Q) Why is forensic and governance analysis important?
Forensic and governance analysis is crucial as it helps uncover hidden risks like earnings manipulation, governance lapses, or financial instability. By identifying these red flags early, potential losses can be avoided and more informed decisions can be taken, ensuring portfolios remain resilient and trustworthy.
Q) What parameters are considered in NJ AMC’s Forensic & Governance Model?
The model evaluates multiple parameters, including Promoter Pledge, Operating Cash Flow to EBITDA, Contingent Liabilities to Net Worth, Auditor Remuneration Growth, Capital Work in Progress (CWIP) to Net Fixed Assets, and more. Each parameter is carefully chosen to highlight potential governance or financial risks, enabling the model to filter out red-flagged companies effectively.
Investors are requested to take advice from their financial/ tax advisor before making an investment decision.
MUTUAL FUND INVESTMENTS ARE SUBJECT TO MARKET RISKS, READ ALL SCHEME RELATED DOCUMENTS CAREFULLY.
« Previous Next »